Our solution
AI-powered detection, from the air to the map
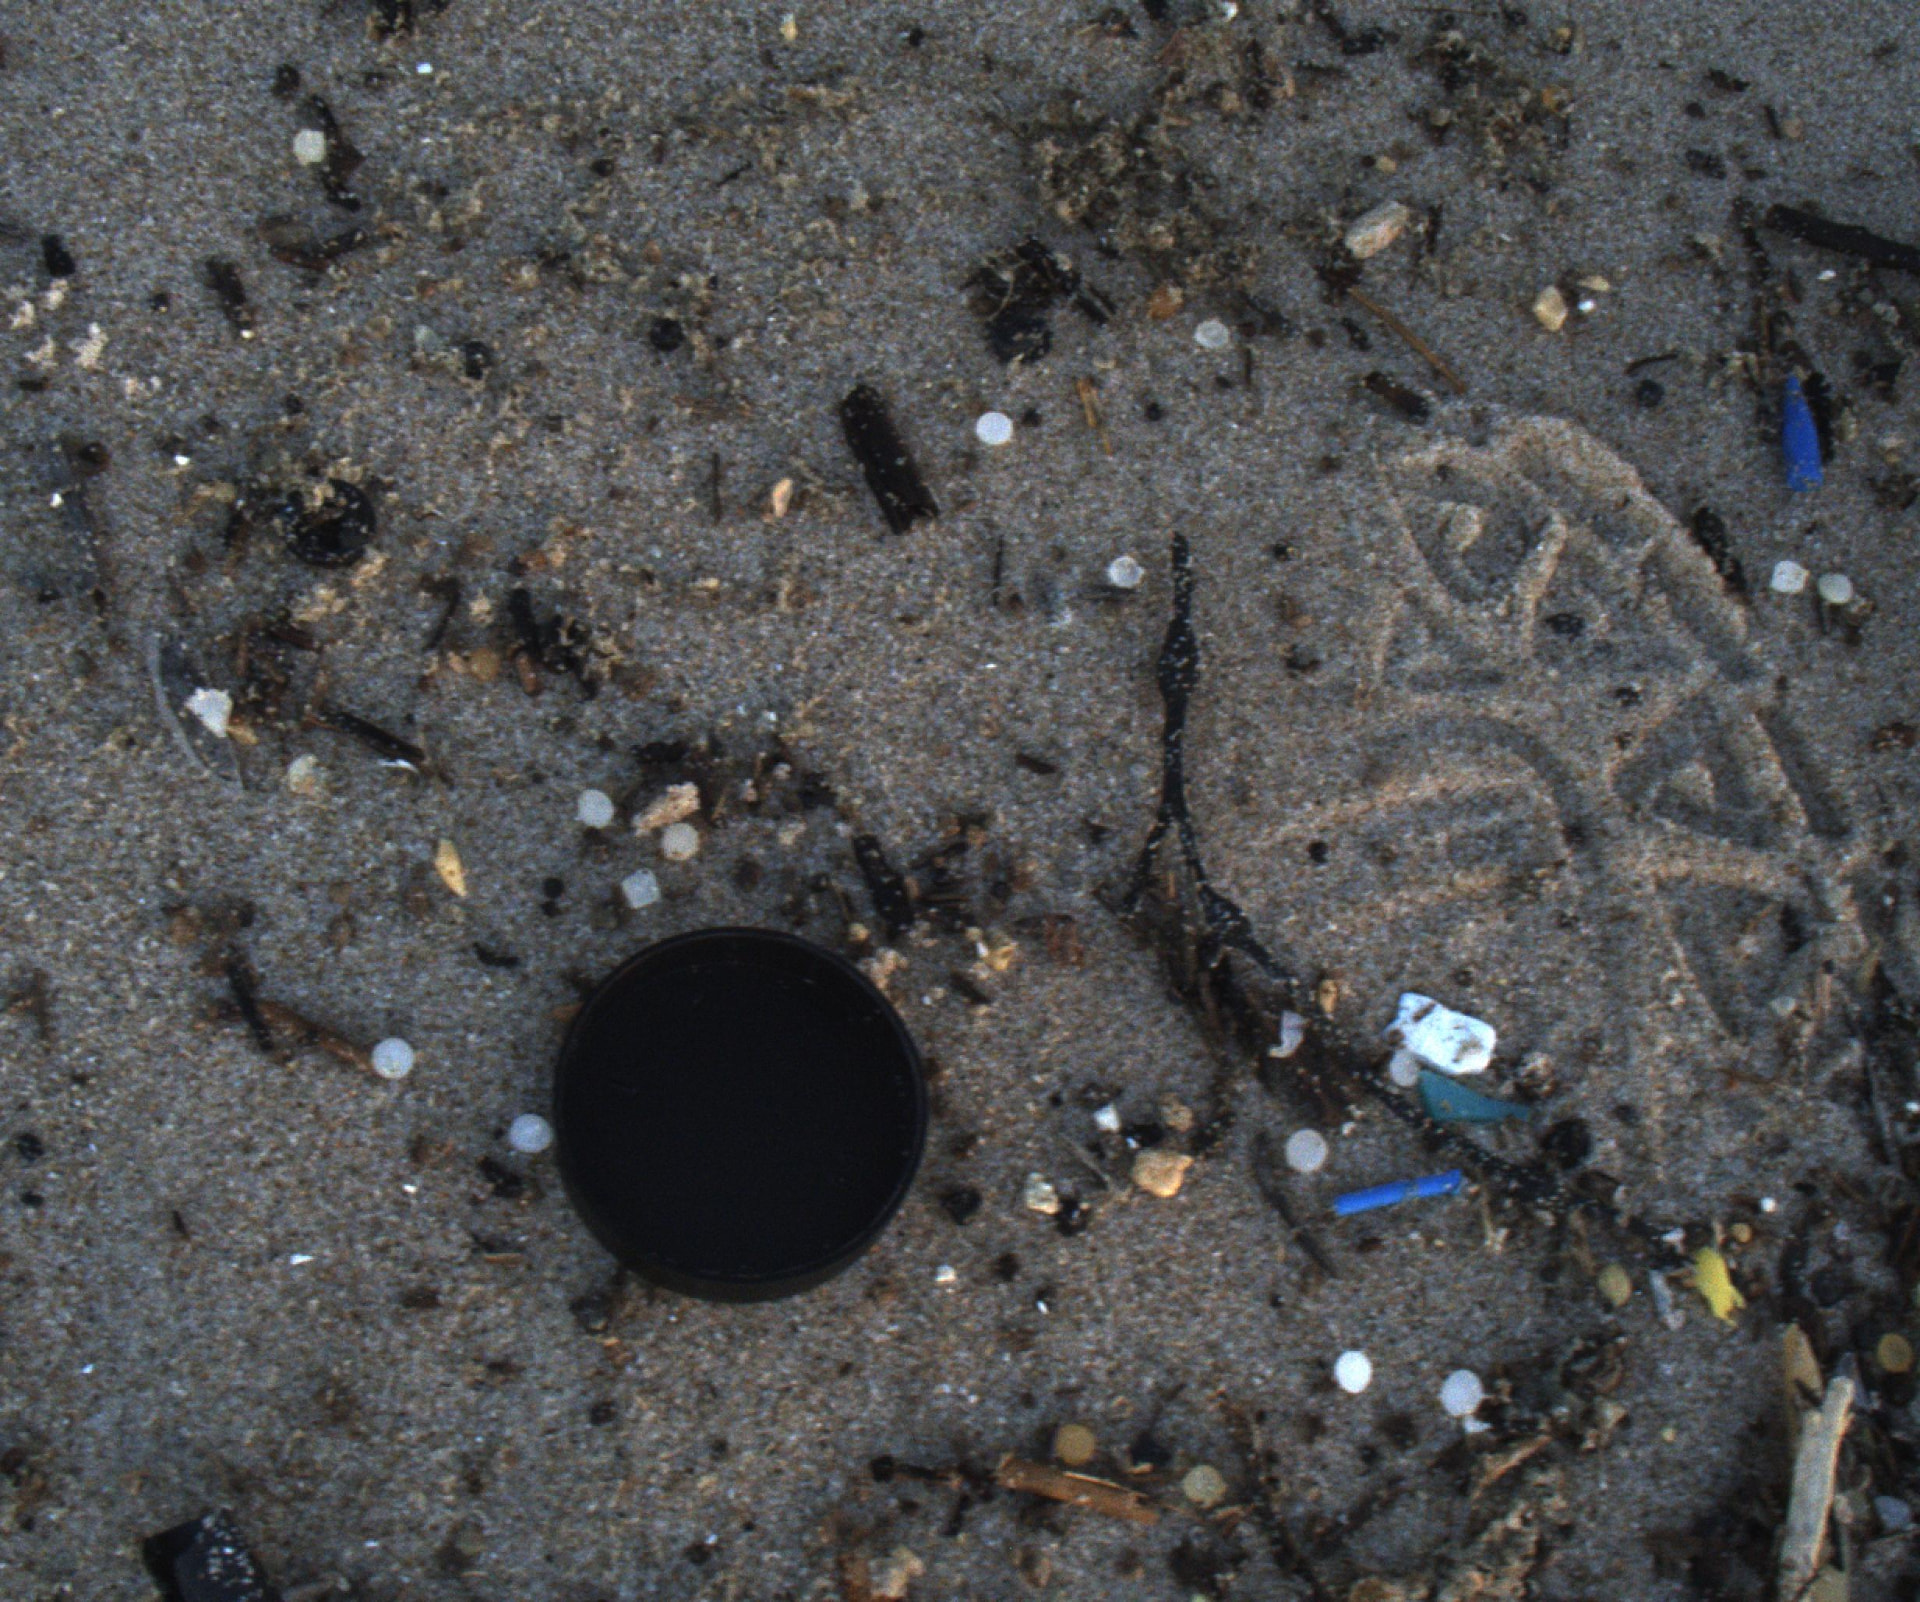
A single frame from a Danish beach, exactly as the camera captures it.
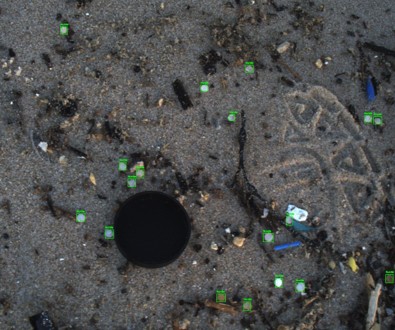
It takes a human up to 5 minutes to localize and annotate every plastic pellet.
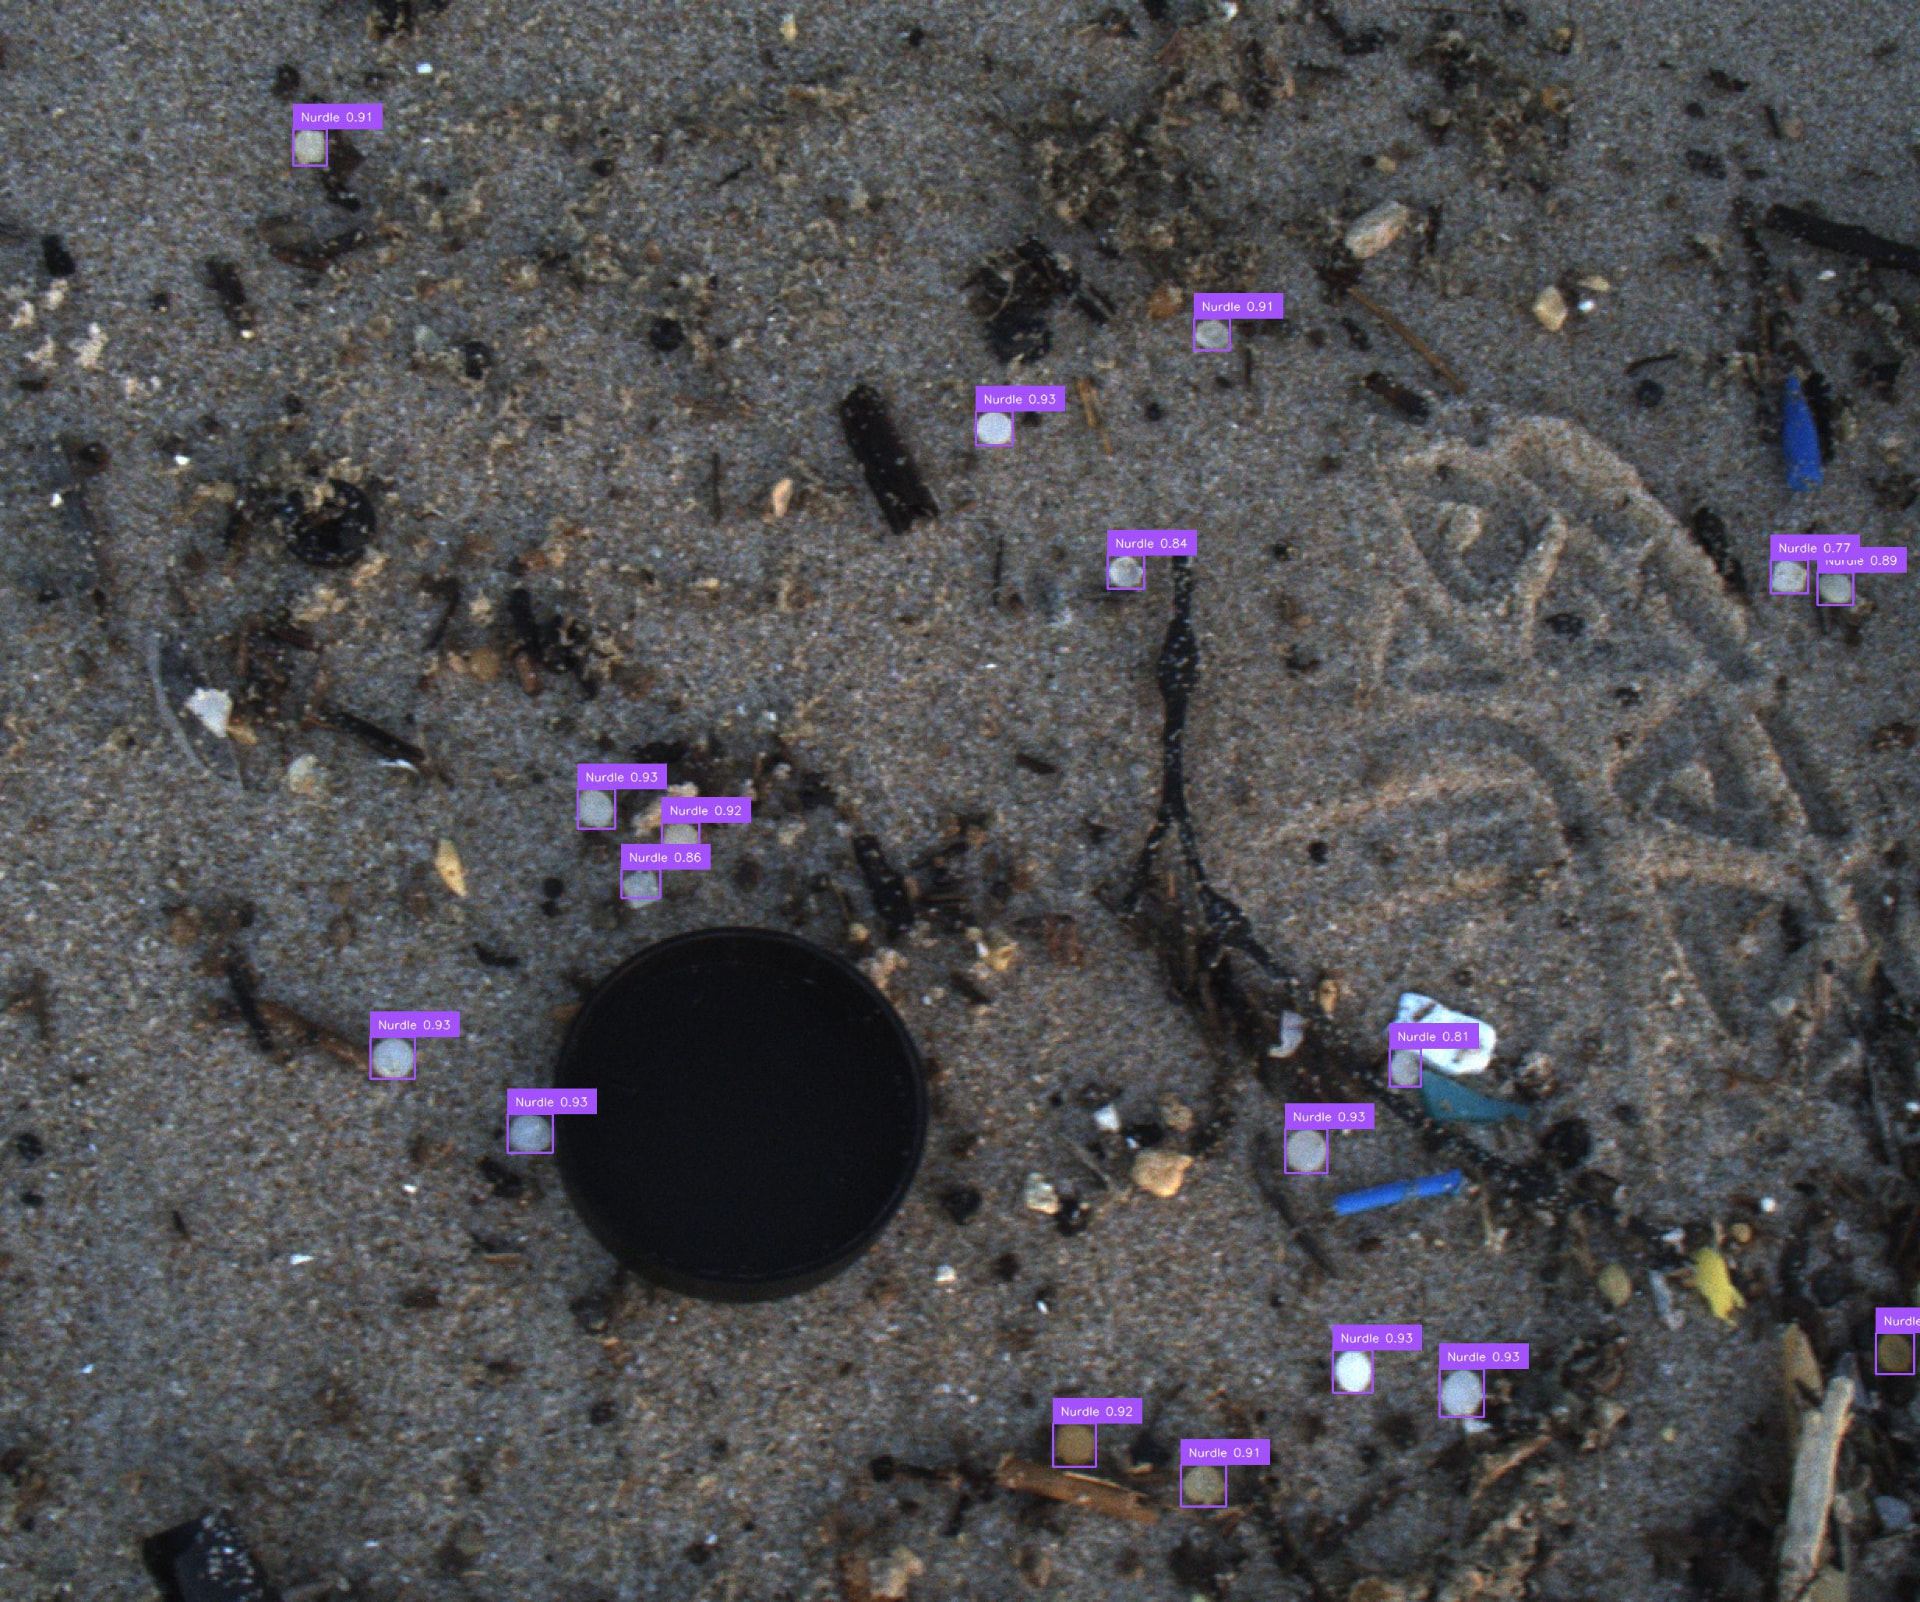
Race for Oceans Technology's AI object detection models localize and map plastic pellets in less than a second.
Our own software & AI platform
We build our software and train our AI object detection models in-house. Data comes from high-resolution drone imagery and from app users on the ground, creating a growing dataset of visible microplastics on land. Our models are trained for the terrain where conventional detection fails, which allows us to identify, classify and map waste down to 2 mm.
The platform turns every frame into geolocated data: location, density and trends over time, surfaced through dashboards and APIs. That insight guides autonomous collection robots to the pollution, and it supports decisions for governments, municipalities and private stakeholders. What looks like plain sand to the eye becomes precise and countable data, and easily allows for removal of at least 90% of visible microplastics.
Each survey produces an automated report that quantifies the pollution, maps its location, and outlines a cleanup plan with estimated time, effort and impact. Allowing collection robots to follow the plan, and autonomously remove the visible microplastic.
From drones to collection robots
- 01
Survey
Drones capture high-resolution imagery of the coastline.
- 02
Detect & map
Our AI object detection models analyse the imagery to locate visible microplastics and map their distribution.
- 03
Report
The findings are compiled into a detailed report covering:
- Pollution levelsHow much microplastic is present
- LocationWhere it is concentrated
- Cleanup planThe most effective way to remove it
- Time & costEstimated cleanup time and projected price
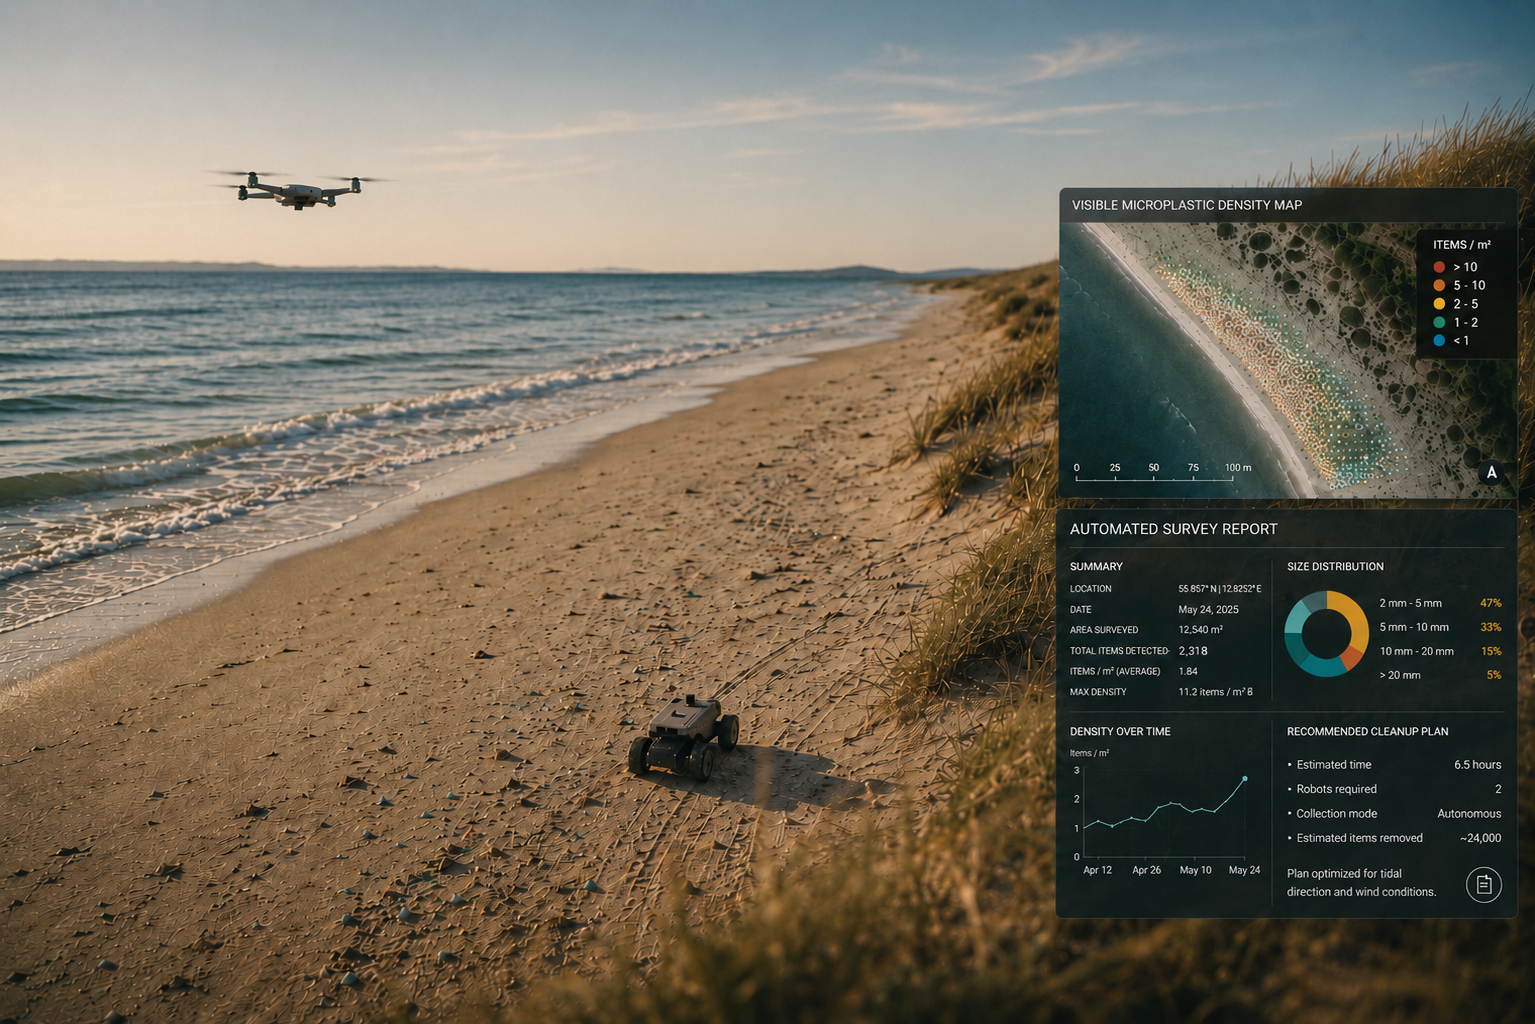
One loop: the drone sees, the model understands, the robot acts, and the next flight proves the work.
Who we work with
Governments
Compare pollution levels between regions using one consistent method. Report on national and EU commitments with field measurements instead of estimates.
Municipalities
Know which stretches of coast are worst affected before sending a crew out. Document what was removed, where, and how the situation develops season by season.
Private stakeholders
Producers, ports and transporters can quantify what is escaping around their own sites. That turns plastic pellet loss from an unknown liability into a number that can be reduced.